SUPERMARKET SALES DASHBOARD
Interactive PowerBI Dashboard
This interactive dashboard was made to develop a solution for managers to determine whether they are meeting KDE goals, what to expect in the future, demographic analyses for future products, and can compare between different stores to see their product shelf strategy and effectiveness.
 |  |  |
|---|
MONKEYPOX DASHBOARD
Interactive PowerBI Dashboard
At the beginning of May, an outbreak took place which continues to grow in several countries.
I was inspired to make a dashboard that gained actual insights related to current events. The dashboard is fully interactive, has full functionality with filtering and slicers, and the best part -- it proactively updates itself as soon as more data comes in.
 |  |  |
|---|
ELECTRICITY CONTRACT INSIGHTS REPORT
PowerBI Forecast Report
In Finland, you can choose to make a contract for a fixed electricity price.
My fiancé asked whether we should make a contract. The data says we should wait another year.
I wrote up a proposal with visuals which determined the forecasted contract time and length, significant factors which might spark change in the data, and other viability options using SWOT analysis.
Here's some visualizations and a forecast that help paint the picture.
The dataset was obtained by a Nordic government website designed for the fields of physical science.
 |  |  |
|---|
DIABETES PREDICTION - 88% ACCURACY
Python Machine Learning, twelve learning models.
My first attempt at machine learning. The process involved inspecting variables and unique values, eliminating and substituting NaN values, normalizing data, scaling data, and utilizing a number of beginner machine learning models.
Link:
https://www.kaggle.com/code/jeremyspaansen/pima-indians-diabetes-prediction?scriptVersionId=98991739
 |  |  |
|---|
SLEEP CORRELATION ANALYSIS REPORT
SPSS and Google Docs - Pearson's Correlation, One-Way ANOVA tests
 |  |  |
|---|
This is real data file condensed from a study conducted to explore the prevalence and impact of sleep problems on various aspects of people's lives. Staff from a university in Melbourne, Australia were invited to complete a questionnaire containing questions about their sleep behavior (e.g. hours slept per night), sleep problems (e.g. difficulty getting to sleep) and the impact that these problems have on aspects of their lives (work, driving, relationships). The sample consisted of 271 respondents (55% female, 45% male) ranging in age from 18 to 84 years (mean=44yrs).
The results found from the study found that anxiety and depression were likely the most significant reason of sleep problems.
The most prevalent side-effects were sleepiness, lethargy, and lack of energy.
Link:
https://docs.google.com/document/d/1KuIVaIdFb5Dw5kmqbTJ6qEdNciEomef5dG29EoeOsZE/edit?usp=sharing
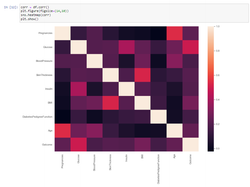
TOP 100 YOUTUBERS
Python Exploratory Analysis
This insights analysis was able to find correlations about the formula of being a successful content creator on the popular website YouTube.
Specifically, it found the viability of newer content creators on the site and what genres ought to be the most successful depending on which goal is set by the team.
Link:
https://www.kaggle.com/jeremyspaansen/top-youtube-channels-eda
 |  |  |
|---|---|---|
 |
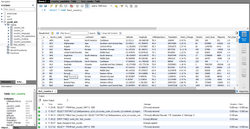
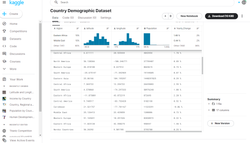
WORLD DEMOGRAPHICS DATASET
MySQL (Data Definition, Data Manipulation, Transactional Language)
 |  |
|---|
This dataset was created in mind to find insights about the correlations between a country's location and key demographic features. The data was extracted from five different datasets and manipulated using INNER JOIN, SELECT, GROUP BY, HAVING BY and subqueries to generate desirable results.
The data was then evaluated by a data engineer who certified the integrity and viability of the dataset and provided further insight to improve the work. My next goal is to perform a correlation analysis report on this dataset.
Link: https://www.kaggle.com/datasets/jeremyspaansen/country-demographic-dataset
PROPERTY RENTALS INTERACTIVE DASHBOARD
Python Deepnote
 |  |
|---|
PROPERTY RENTALS INTERACTIVE DASHBOARD
Python Deepnote
 |  |  |
|---|